Portfolio Model v1
This page describes the allocation model used at the One Click app to create risk-oriented DeFi portfolios.
Model purpose
The problem every DeFi user encounters is the research & discovery of prominent yield opportunities.
There are tens of thousands of different pools across dozens of blockchains, there are different types of yield (staking, lending, liquidity providing), and there are different types of risks that can catch unsuspecting DeFi farmers off guard.
The purpose of the One Click model is to simplify the yield discovery process.
The model achieves this goal by aggregating pools from hundreds of yield protocols across multiple blockchains and recommending the best pools from a risk-reward perspective to the user.
Model scope
The portfolio model consists of the following components:
Risk assessment questionnaire: Users must answer ten single-choice questions about their behavior to help the model understand the user’s risk profile -> relevant pools to recommend.
Blockchain data parsing and analytics: The model also takes into account the user’s on-chain interaction history with protocols and assets to generate a more personalized portfolio.
Database of DeFi pools: On the backend of the system, there is a database of manually researched and vetted pools, assets, and protocols from which the end portfolio is composed.
Algorithm for picking pool allocations: Finally, there is an algorithm that matches the user’s risk score and on-chain history to determine the most relevant DeFi pools from a risk-reward perspective.
Fundamentals
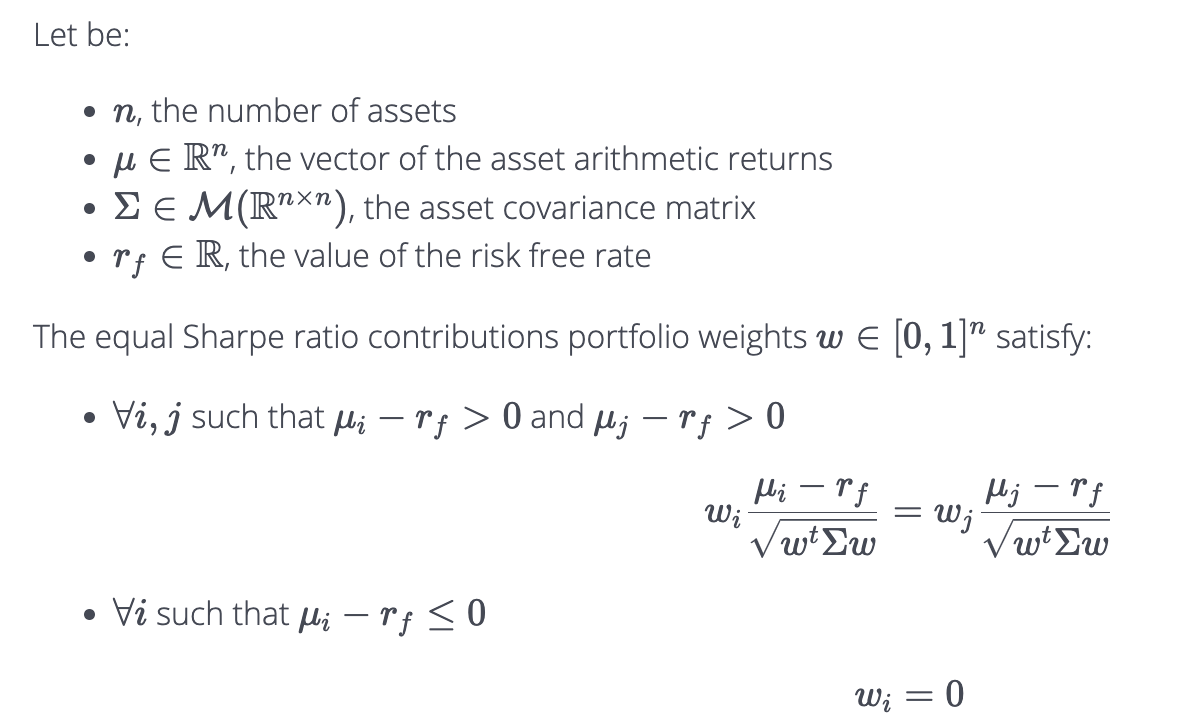
The general methodology behind portfolio construction is Equal Sharpe Ratio Contributions (ESRC).
Equal Sharpe Ratio Contributions (ESRC) portfolios are a type of portfolio optimization methodology that seeks to equalize the Sharpe ratios of individual assets in the portfolio. The Sharpe ratio is a commonly used measure of risk-adjusted return, which takes into account both the expected return and the volatility of an opportunity.

The main idea behind ESRC portfolios is to allocate capital in such a way that each asset contributes an equal amount of risk-adjusted return to the overall portfolio. To construct an ESRC portfolio, one first calculates the Sharpe ratio of each asset in the portfolio. Next, one calculates the contribution of each asset to the total portfolio Sharpe ratio. This is done by multiplying the asset’s Sharpe ratio by the weight of the asset in the portfolio, and then dividing by the total portfolio Sharpe ratio. The weights are then adjusted so that each asset contributes an equal amount of risk-adjusted return to the portfolio.
ESRC portfolios have some advantages over other portfolio optimization methodologies. For example, they provide a more balanced risk-return tradeoff across the portfolio, which can help to reduce the risk of large drawdowns while maintaining a high expected return. Additionally, they can be more robust to changes in the correlation structure of the assets in the portfolio. Finally, they take into account both the expected return and the risk of individual assets, which can help users to make more informed decisions.
However, there are also some limitations to ESRC portfolios. For example, they may not be suitable for user's with specific risk or return objectives, as they focus solely on the Sharpe ratio. Additionally, ESRC portfolios may have higher turnover than other portfolio optimization methodologies, as the weights of the assets in the portfolio need to be constantly adjusted to maintain equal risk-adjusted contributions. Finally, ESRC portfolios may be more difficult to implement than other portfolio optimization methodologies, as they require the calculation of the Sharpe ratios of individual assets in the portfolio.
Evaluating Risk Score
For the ESRC model to work best, we need to determine the optimal risk variable for the end portfolio. We do that by analyzing user’s preferences through a questionnaire.
The v1 questionnaire consists of ten questions, each aiming to target a particular aspect of the user’s risk preference.

The One Click Crypto questionnaire is similar to the onboarding process done in traditional robo-advisors like Wealthfront or Betterment. Before recommending a portfolio, the system needs to understand the end user’s risk preferences.
At the end of the questionnaire, the system assigns a score on a scale from 1 to 10 with 0.5 increments that determines the user’s risk (1 — lowest, 10 — highest).

Pools/protocols/assets database
At One Click Crypto, we maintain a database of DeFi pools, chains, assets (coins), and protocols. Pools from the database are used in the end portfolio composition.
Each pool, chain, protocol, and asset has its “risk” score attached to it. This risk is measured on a scale from 1 to 5, 1 being the safest and 5 being the riskiest.
Risk calculation is a combination of various metrics such as pool/protocol maturity, cyber security, yield source, assets in the pool, liquidity, and others.
Risk is determined both at the pool's individual level as well as the pool’s relation to the overall assets, protocol, and chain risks.
Asset volatility also plays a role in risk calculation, whereby pools with stablecoin assets are biased to have lower risk scores than pools with non-stablecoin volatile assets.
Pools with volatile assets also have a higher chance to get recommended to riskier portfolios as these assets are likely to appreciate over time, delivering an extra return in addition to yield.
In addition to risk, each pool has an APY % metric. Both risk and APY metrics are used to determine the optimal portfolio.
Matching Pools with User Risk
The process of constructing the portfolio of pools that matches user risk is the following:
Calculate user risk based on the questionnaire
Fetch available pools from the database of pools
Compare pools based on the quality of their opportunity using the ratio between their risk and expected reward metrics
Filter out pools that have a too high risk or low expected return
Filter out pools that don’t meet the user’s risk criteria (e.g. yield too low, risk too high)
Sort remaining pools by the scaled expected return — metric that determines risk-adjusted return, where the pools with the highest expected return are at the top.
Recommend pools based on their scaled expected return to the user.
This matching process allows for a diversity of portfolios and lets the users with the highest risk scores pursue the highest return portfolios.
It also helps to ensure that portfolio returns increase linearly with users’ risk scores.
The potential drawback of this approach is that since the returns are not positively correlated with the risk of the pools, the risk of the portfolios does not necessarily increase linearly with the users’ risk score. This is why other mechanisms are in place to filter out pools that do not meet the user’s risk criteria.
Blockchain Analytics
On-chain analytics is an integral part of the One Click Crypto portfolio system. Although blockchain data isn’t used for risk assessment, it helps to recommend a more optimized portfolio of pools tailored to user preferences.
How it works
On the first screen of One Click Crypto app, user connects their wallet. The system then scrapes all transaction history on the supported chains related to the linked wallet address.

After that, the system analyzes user’s chain activity history, protocol activity history, and asset history to gain a better perspective about the user’s profile.
Using the collected on-chain data about the user, One Click’s model runs through a network of existing wallet addresses to find user profiles with similar activity patterns + what yield opportunities worked well for them in the past + what yield pools they are using now.
Finally, all the identified matching pools get filtered to remove low-quality opportunities and the final set of pools gets included in the overall portfolio.
By combining on-chain analytics with behavioral analysis, we can create more robust and personalized portfolios that deliver greater value to users.
Portfolio Weighting Methodology
The weighting of pools in a portfolio (determining the % of allocation to each pool) is done by using the scaled ratio metric.
Scaled ratio is derived from scaled expected return and scaled risk calculations and is basically a representation of the risk-reward ratio of a particular pool.
The weighting of each pool inside the portfolio is done by dividing scaled ratio of the pool by the sum of all pool scaled ratios in the identified portfolio.
This weighting mechanism is a simplified version of the Diversified Maximum Sharpe Ratio approach, assigning greater weights to pools that have higher scaled ratio values.
Such methodology places more emphasis on the pools that have superior Sharpe ratios. So, the better return-risk opportunities get higher weights in the portfolio. It will produce portfolios with the best balance between expected returns and risk.
However, relative to other methodologies, it may not produce portfolios with the highest expected returns or the lowest risk, but it finds an optimal mix between the two objectives. It is also much more effective in situations where the returns and risks of pools are not correlated.
Model Limitations
Although the One Click Crypto portfolio model is a powerful tool that helps to identify the best risk-to-reward yield farming opportunities as of now, it has a set of limitations:
The model doesn’t consider fees: Gas fees, bridging fees, management fees, or other types of protocol fees can be a deciding factor for considering certain yield opportunities. As of V1, the fees are not included in the calculation.
The model doesn’t consider a payout asset: In V1 of the model, the APY metric is simplified and doesn’t specify in which asset the pool reward will be paid out. Depending on the quality of payout assets, some yield pools might be more appealing than others.
The model doesn’t count for base+boost APY: Similarly to the above point, the current model doesn’t account for potential boosts that are offered for some yield farming pools.
Limited view of a trend: For the APY metric, the model uses average APY data for the last 30 days. Therefore, it cannot identify whether the yield is trending upwards or downwards over time. Trend following can be an effective strategy in yield farming, and the current model might miss out on some decent opportunities where APY started picking up only in the last 24–48 hours.
Summary
One Click Crypto’s DeFi portfolio model is a useful tool that can help to identify great risk-reward yield farming opportunities with little effort.
The model uses a risk questionnaire that helps users to evaluate their risk profile and generate a portfolio to their preferences. The model also uses analytics from the user’s wallet on-chain history to further personalize the portfolio.
Although effective, the model has its limitations and doesn’t account for fees, reward assets, and trends.
Overall, the model can be a great tool to get your foot into the DeFi yield door no matter if you are a novice, intermediate, or expert DeFi user.
References
(1) Sharpe Ratio Contribution and Attribution Analysis by Andreas Steiner
In this paper, two methods to analyze contributions to Sharpe Ratio are discussed as well as ways to attribute Sharpe Ratios differences to meaningful management decisions.
(2) Computation of the marginal contribution of Sharpe ratio and other performance ratios by Eric Benhamou
This paper describes the contribution of performance ratios like Sharpe, Treynor, Calmar, or Sterling ratios to asset management.
(3) “Equal Risk Contribution Portfolios under the Microscope” by Maillard, Roncalli, and Teiletche.
This paper introduces the ESRC portfolio optimization methodology and compares it to other portfolio optimization approaches. The authors demonstrate that the ESRC approach can provide superior risk-return tradeoffs compared to other approaches, such as mean-variance optimization and risk parity.
(4) “Equal Sharpe Ratio Portfolios: A Practical Optimization Approach” by Desiderio, Giuli, and Veltri.
This paper presents a practical implementation of the ESRC portfolio optimization methodology using linear programming techniques. The authors show that the ESRC approach can be implemented in a straightforward manner and can lead to significant improvements in risk-adjusted returns compared to traditional mean-variance optimization.
(5) “Generalized Equal Risk Contributions Portfolio Optimization” by Qian and Yoon.
This paper extends the ESRC portfolio optimization methodology to a more general class of utility functions. The authors demonstrate that the generalized ESRC approach can be used to construct portfolios that meet a wide range of user preferences, including risk-averse and risk-seeking users.
Last updated